Special Education at University of South Florida - St. Petersburg
If you plan to study special education, take a look at what University of South Florida - St. Petersburg has to offer and decide if the program is a good match for you. Get started with the following essential facts.USFSP is located in St. Petersburg, Florida and approximately 4,895 students attend the school each year. During the 2018-2019 academic year, 4 students received their master's degree in special ed.
Want to know more about the career opportunities in this field? Check out the Careers in Special Education section at the bottom of this page.
Featured schools near , edit
USFSP Special Education Degrees Available
- Master’s Degree in Special Ed
USFSP Special Education Rankings
Special Ed Student Demographics at USFSP
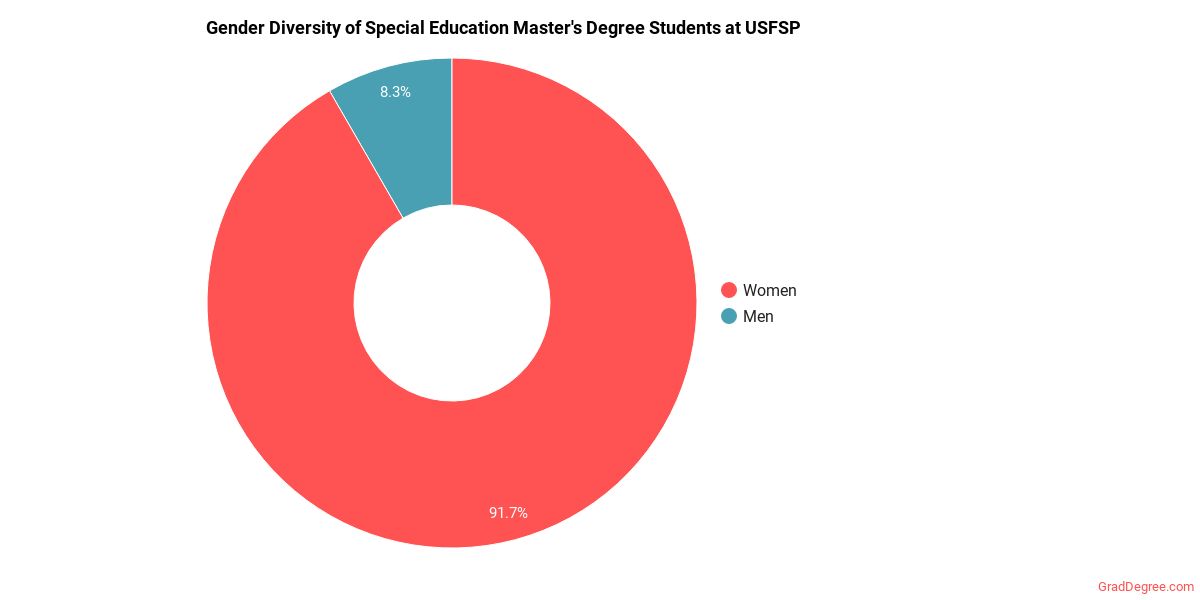
Take a look at the following statistics related to the make-up of the special ed majors at University of South Florida - St. Petersburg.
USFSP Special Education Master’s Program
In the special ed master's program at this school, racial-ethnic minorities make up 50% of degree recipients. That is 25% better than the national average.*
The following table and chart show the race/ethnicity for students who recently graduated from University of South Florida - St. Petersburg with a master's in special ed.

| Race/Ethnicity | Number of Students |
|---|---|
| Asian | 0 |
| Black or African American | 0 |
| Hispanic or Latino | 2 |
| White | 2 |
| International Students | 0 |
| Other Races/Ethnicities | 0 |
Related Majors
Careers That Special Ed Grads May Go Into
A degree in special ed can lead to the following careers. Since job numbers and average salaries can vary by geographic location, we have only included the numbers for FL, the home state for University of South Florida - St. Petersburg.
| Occupation | Jobs in FL | Average Salary in FL |
|---|---|---|
| Special Education Teachers | 7,310 | $51,500 |
| Kindergarten or Elementary School Special Education Teachers | 5,020 | $60,720 |
| Special Education Professors | 4,660 | $55,080 |
| Interpreters and Translators | 3,720 | $49,300 |
| Middle School Special Education Teachers | 2,490 | $55,050 |
References
*The racial-ethnic minorities count is calculated by taking the total number of students and subtracting white students, international students, and students whose race/ethnicity was unknown. This number is then divided by the total number of students at the school to obtain the racial-ethnic minorities percentage.
- College Factual
- National Center for Education Statistics
- O*NET Online
- Image Credit: By CJWilkins under License More about our data sources and methodologies.

GradDegree.com provides higher-education, college and university, degree, program, career, salary, and other helpful information to students, faculty, institutions, and other internet audiences. Presented information and data are subject to change. Inclusion on this website does not imply or represent a direct relationship with the company, school, or brand. Information, though believed correct at time of publication, may not be correct, and no warranty is provided. Contact the schools to verify any information before relying on it. Financial aid may be available for those who qualify. The displayed options may include sponsored or recommended results, not necessarily based on your preferences.
© GradDegree.com – All Rights Reserved.