University of the Sciences Graduate Programs
Located in Philadelphia, Pennsylvania, University of the Sciences is a private not-for-profit institution. The location of the school is great for students who enjoy the amenities of city life.
Featured schools near , edit
Awards From Around the Web
The following table lists some notable awards USciences has earned from around the web.
| Rank | Ranking Name | Source |
|---|---|---|
| #10 | Best Value Colleges for Health Professions | College Factual |
| #16 | Best Colleges for Health Professions | College Factual |
Where Is University of the Sciences?
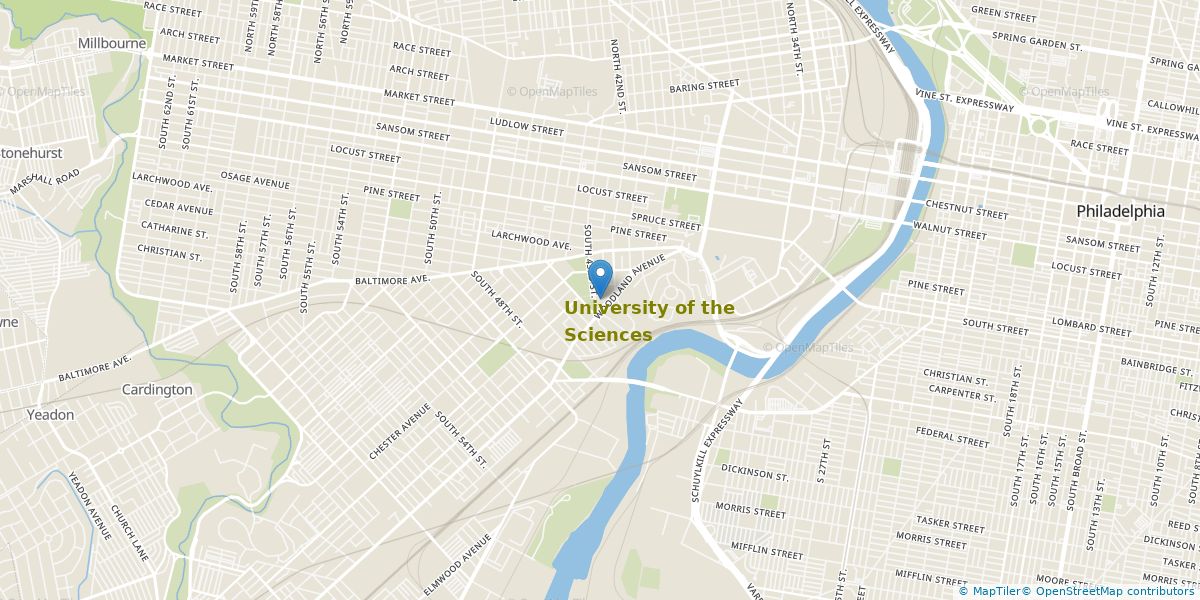
Contact details for USciences are given below.
| Contact Details | |
|---|---|
| Address: | 600 South 43Rd Street, Philadelphia, PA 19104-4495 |
| Phone: | 215-596-8800 |
| Website: | www.usciences.edu |
| Facebook: | https://www.facebook.com/USciences |
| Twitter: | https://twitter.com/usciences |
University of the Sciences Graduate Student Diversity
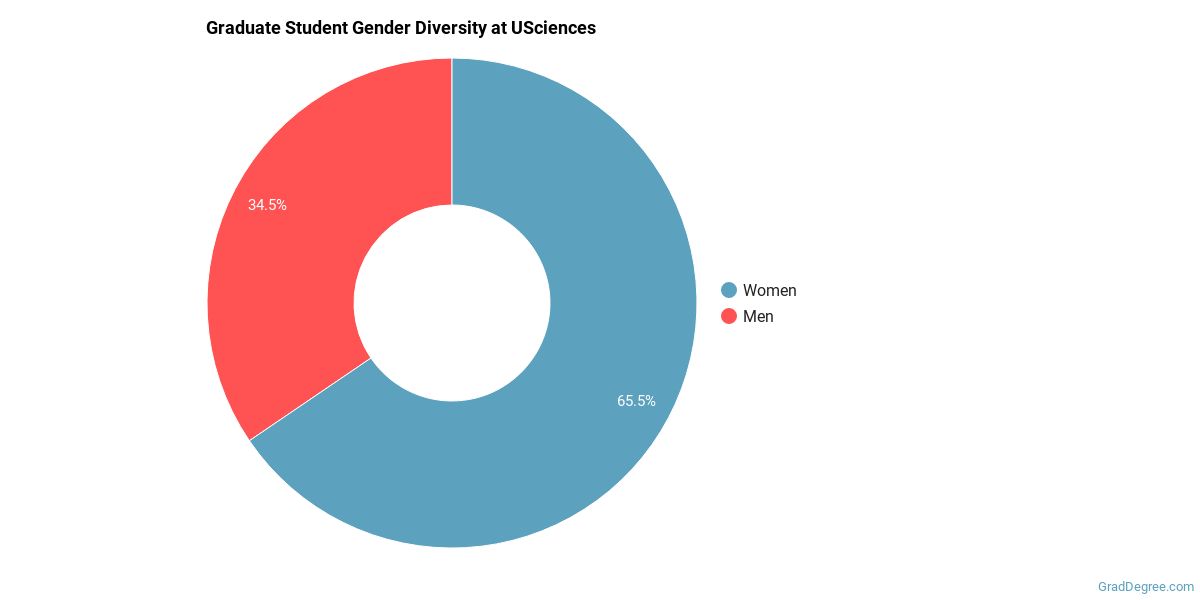
Gender Diversity
Of the 913 graduate students at USciences, 35% are male and 65% are female.
Racial-Ethnic Diversity
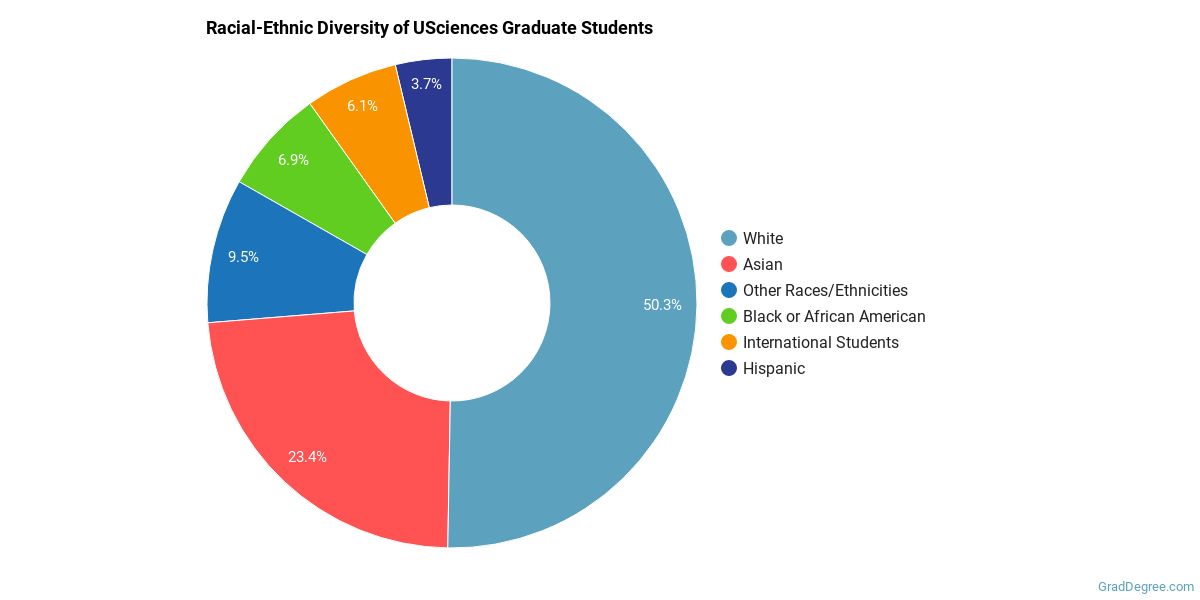
The racial-ethnic breakdown of University of the Sciences graduate students is as follows.
| Race/Ethnicity | Number of Grads |
|---|---|
| Asian | 214 |
| Black or African American | 63 |
| Hispanic or Latino | 34 |
| White | 459 |
| International Students | 56 |
| Other Races/Ethnicities | 87 |
Geographic Diversity
Pennsylvania students aren't the only ones who study at University of the Sciences. At this time, 19 states are represented by the student population at the school.
Over 22 countries are represented at USciences. The most popular countries sending students to the school are Saudi Arabia, India, and South Korea.
Online Learning at University of the Sciences
The following chart shows how the online learning population at USciences has changed over the last few years.
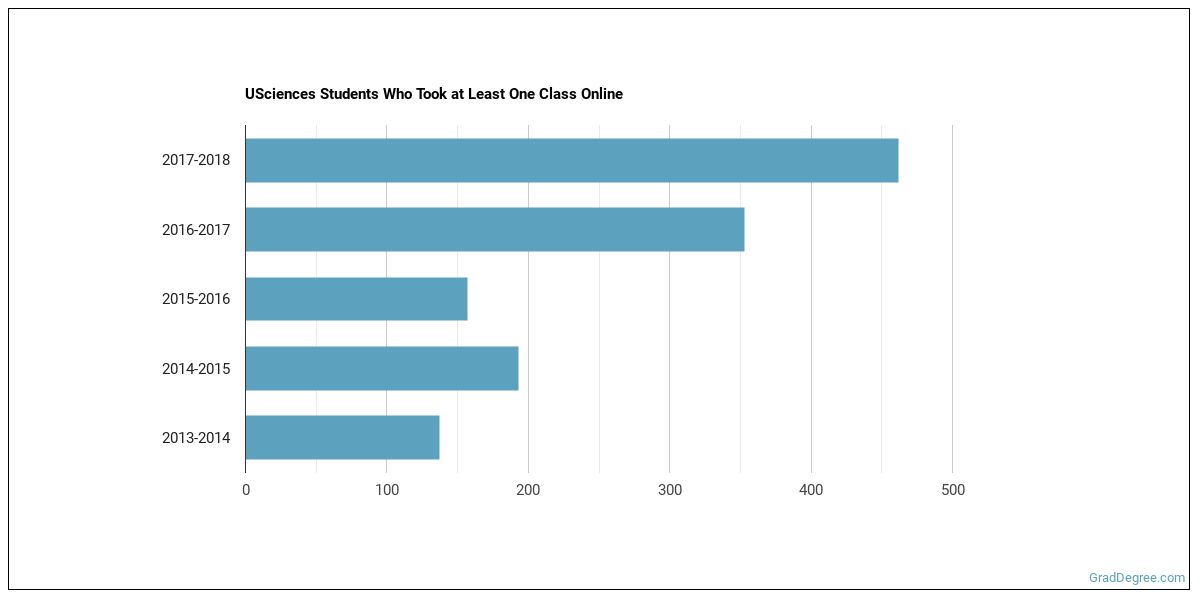
This school is the 55th most popular in Pennsylvania for online learning according to the online graduations recorded by the Department of Education for the academic year 2017-2018.
Online Growth Rankings of USciences
The average growth rate over the last four years of online students at University of the Sciences was 35.1%. This is the #399 largest growth rate of all schools that are only partially online. This refers to all students at USciences regardless of major.
The following table shows the 1-year growth rate of USciences majors that offer at least one online course. This table only includes majors with positive growth.
| Major | 1-Year Growth Rate |
|---|---|
| English Language & Literature | 31% |
| Writing Studies | 31% |
The table below shows how the average growth rate over 4 years at USciences ranks compared to all other partially online schools that offer a specific major. Note that the majors may or may not be offered online at USciences.
| Major | Growth Rate Rank | |
|---|---|---|
| Pharmacy/Pharmaceutical Sciences | #2 | |
| Writing Studies | #7 | |
| English Language & Literature | #8 | |
| Public Health | #11 | |
| Health Professions | #107 |
When we speak of partially online, we are referring to schools whose online population is less than 50% of its total student body. Mostly online refers to those with online populations greater than or equal to 50%.
University of the Sciences Graduate Concentrations
The table below shows the number of awards for each concentration.
| Major | Graduate Certificate | Master’s | Doctor’s | TOTAL |
|---|---|---|---|---|
| Pharmacy/Pharmaceutical Sciences | 4 | 34 | 145 | 183 |
| Rehabilitation & Therapeutic Professions | 0 | 45 | 86 | 131 |
| Allied Health Professions | 0 | 41 | 0 | 41 |
| Writing Studies | 6 | 10 | 0 | 16 |
| Cell Biology & Anatomical Sciences | 0 | 2 | 7 | 9 |
| Food Science Technology | 7 | 0 | 0 | 7 |
| Public Health | 0 | 1 | 5 | 6 |
| Clinical, Counseling & Applied Psychology | 0 | 6 | 0 | 6 |
| Biomathematics & Bioinformatics | 3 | 2 | 0 | 5 |
| Public Relations & Advertising | 4 | 0 | 0 | 4 |
| Pharmacology & Toxicology | 0 | 3 | 0 | 3 |
| Finance & Financial Management | 2 | 0 | 0 | 2 |
| Biochemistry, Biophysics & Molecular Biology | 0 | 1 | 0 | 1 |
| Physiology & Pathology Sciences | 0 | 0 | 1 | 1 |
| Chemistry | 0 | 0 | 1 | 1 |
| Biotechnology | 0 | 0 | 0 | 0 |
| TOTAL | 26 | 145 | 245 | 416 |
References
*The racial-ethnic minorities count is calculated by taking the total number of students and subtracting white students, international students, and students whose race/ethnicity was unknown. This number is then divided by the total number of students at the school to obtain the racial-ethnic minorities percentage.
- College Factual
- National Center for Education Statistics
- Image Credit: By Kakidai under License
More about our data sources and methodologies.
Featured Schools
 Request Info
|
Southern New Hampshire University You have goals. Southern New Hampshire University can help you get there. Whether you need a bachelor's degree to get into a career or want a master's degree to move up in your current career, SNHU has an online program for you. Find your degree from over 200 online programs. Learn More > |

GradDegree.com provides higher-education, college and university, degree, program, career, salary, and other helpful information to students, faculty, institutions, and other internet audiences. Presented information and data are subject to change. Inclusion on this website does not imply or represent a direct relationship with the company, school, or brand. Information, though believed correct at time of publication, may not be correct, and no warranty is provided. Contact the schools to verify any information before relying on it. Financial aid may be available for those who qualify. The displayed options may include sponsored or recommended results, not necessarily based on your preferences.
© GradDegree.com – All Rights Reserved.